
The information contained on this page, and in the infographics and factsheets, represents data reported to the Clean Energy Regulator as at 28 February 2018 for the 2016–17 reporting period. The Clean Energy Regulator may periodically republish National Greenhouse and Energy Reporting data to reflect the most up to date information available and in line with ongoing regulation of compliance. Refer to corporate emissions and energy data 2016–17 and electricity sector emissions and generation data 2016–17 for updated data.
On 28 February 2018, the Clean Energy Regulator published the annual National Greenhouse and Energy Reporting data for the 2016–17 reporting year.
For the 2016–17 year, corporations reported a total of:
- 336 million tonnes of scope 1 greenhouse gas emissions (carbon dioxide equivalent)
- 86 million tonnes of scope 2 greenhouse gas emissions (carbon dioxide equivalent), and
- 3887 petajoules net energy consumed.
Data highlights
Click on the image below to view the PDF
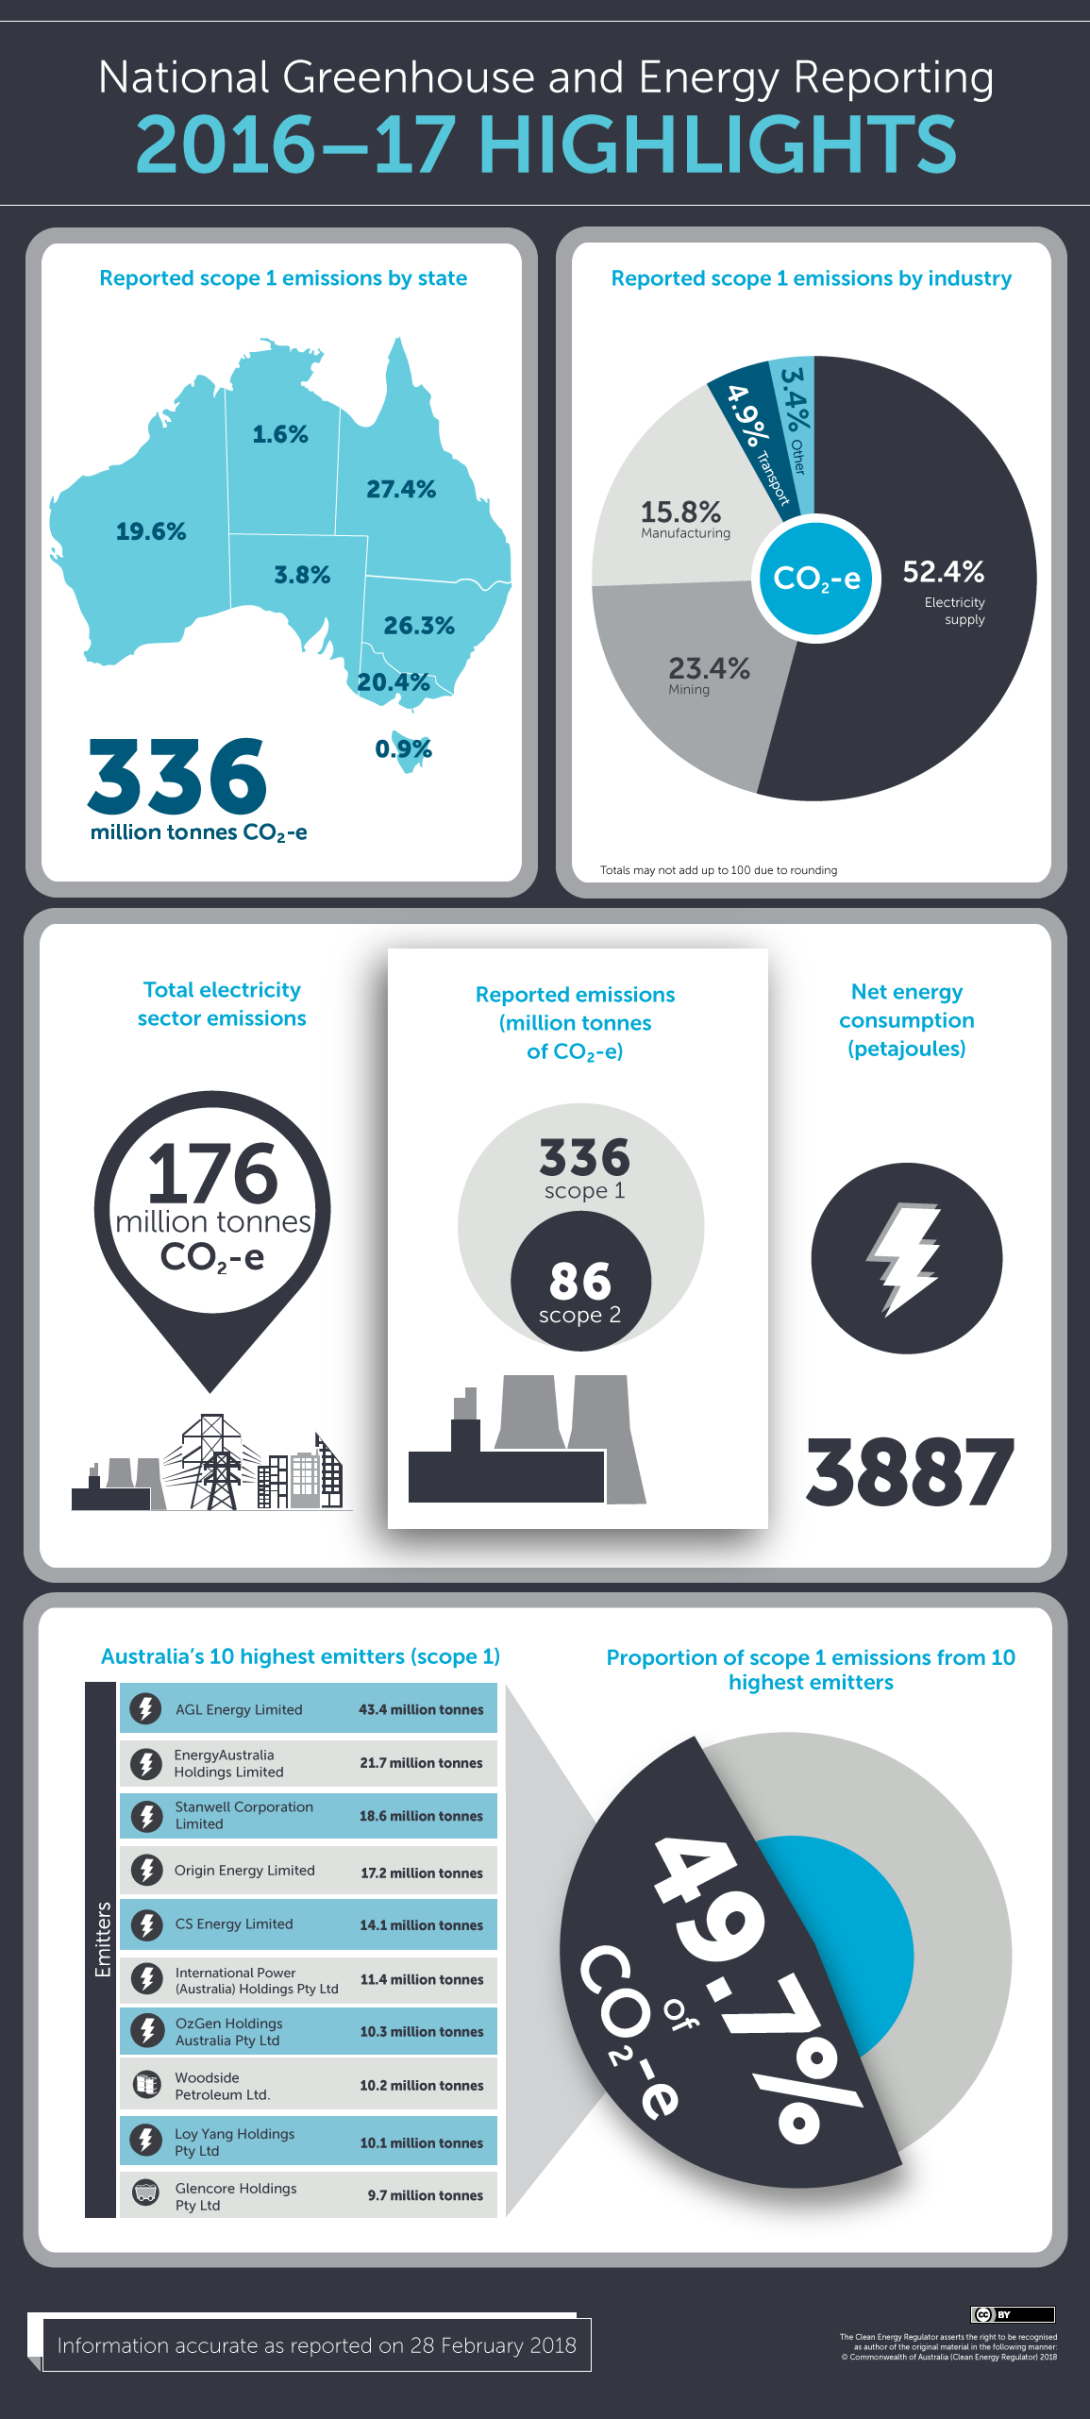
Key highlights for the 2016–17 reporting year:
- Scope 1 emissions grew slightly to 336 million tonnes (carbon dioxide equivalent), an increase of 1.8 million tonnes (or 0.5 per cent) on 2015–16 levels.
- The increase in emissions was largely due to increases in the liquefied natural gas (LNG) sector and oil and gas production sector emissions (7.9 million tonnes). However, the rate of growth slowed due to a decrease in emissions from electricity generation (5.0 million tonnes) and coal mining (1.2 million tonnes).
- The increase in emissions from LNG production (7.9 million tonnes) was largely due to new and increased production in Western Australia and Queensland. For example emissions attributable to the commissioning and start-up of LNG and domestic gas production from the Gorgon Project in Western Australia.
- The increase in emissions from oil and gas extraction and LNG production (7.9 million tonnes CO2-e) was largely due to new and increased production in Western Australia and Queensland, including emissions attributable to the commissioning and start-up of LNG and domestic gas production from the Gorgon Project in Western Australia.
- The next largest contributors to total emissions were the manufacturing sectors collectively, accounting for 15.8 per cent of scope 1 emissions, and the coal mining sector, accounting for 10 percent.
2016–17 datasets
Datasets published for the 2016–17 reporting year include:
- Corporate emissions and energy data
- Electricity sector emissions and generation data
- Extract of the National Greenhouse and Energy Register
It is important to note that information published as part of the 2016–17 National Greenhouse and Energy Reporting dataset cannot be directly compared to publications from previous years for a number of reasons, including updates made to previously published totals to account for report resubmissions. The Clean Energy Regulator takes all reasonable efforts to ensure the information published on its website is accurate at the time of publication.
See more information about what data is published and why.
2016–17 published data factsheets
A series of factsheets are available, which focus on some of the key data released as part of the 2016–17 data publication.