
The information contained on this page, and in the infographics and factsheets, represents data reported to the Clean Energy Regulator as at 28 February 2017 for the 2015–16 reporting period. The Clean Energy Regulator may periodically republish National Greenhouse and Energy Reporting data to reflect the most up to date information available and in line with ongoing regulation of compliance. Refer to corporate emissions and energy data 2015–16 and electricity sector emissions and generation data 2015–16 for updated data.
On 28 February 2017, the Clean Energy Regulator published the annual National Greenhouse and Energy Reporting data for the 2015–16 reporting year.
For the 2015–16 year, corporations reported a total of:
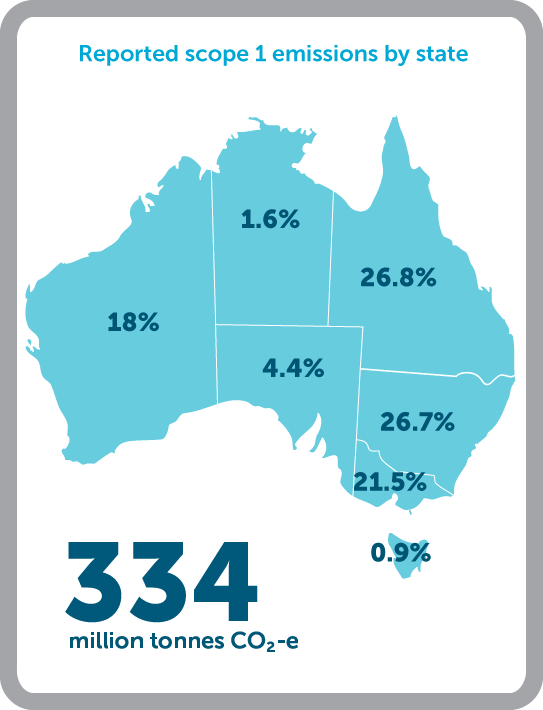
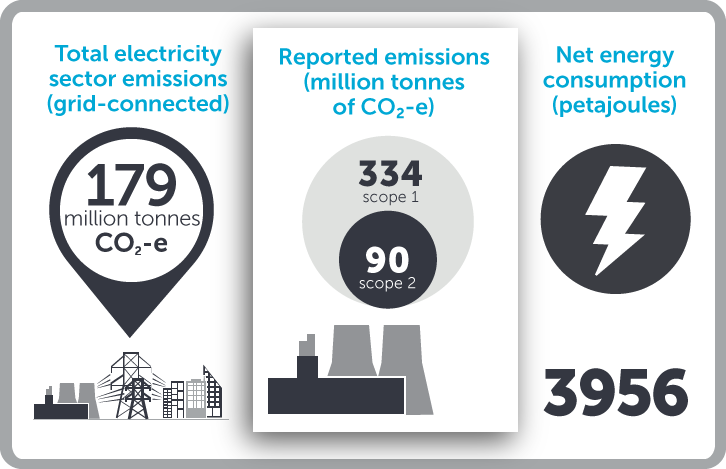
- 334 million tonnes scope 1 greenhouse gas emissions (carbon dioxide equivalence)
- 90 million tonnes scope 2 greenhouse gas emissions (carbon dioxide equivalence), and
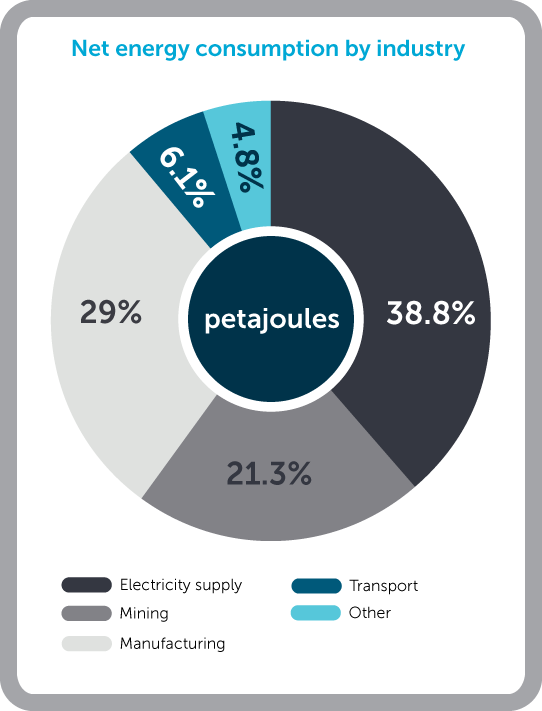
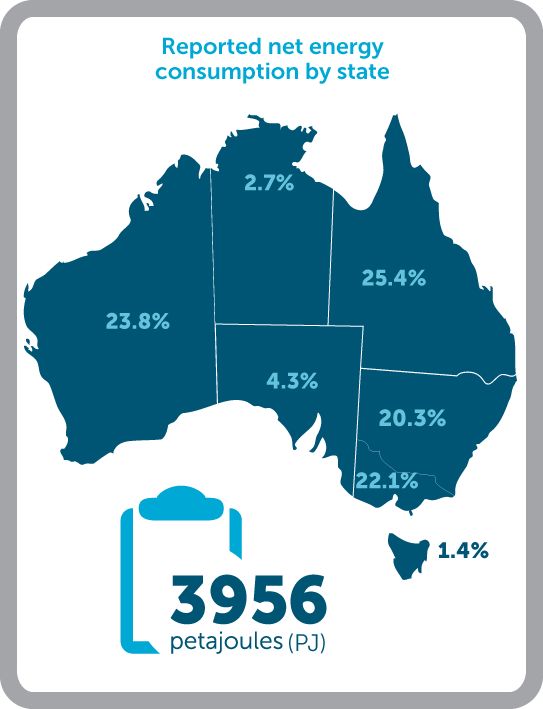
- 3956 petajoules net energy consumed.
Data highlights
Click on the image below to view the PDF

Key highlights for the 2015–16 reporting year include:
- Overall, scope 1 emissions of 334 million tonnes (carbon dioxide equivalence) has increased on adjusted 2014–15 levels by 2.2 percent (data from 2014–15 has been adjusted to reflect updated global warming potential values, which affect the carbon dioxide equivalence of greenhouse gases).
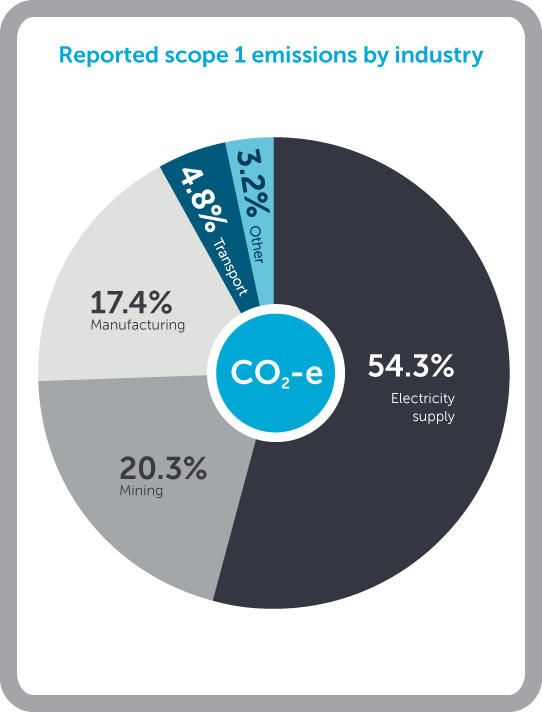
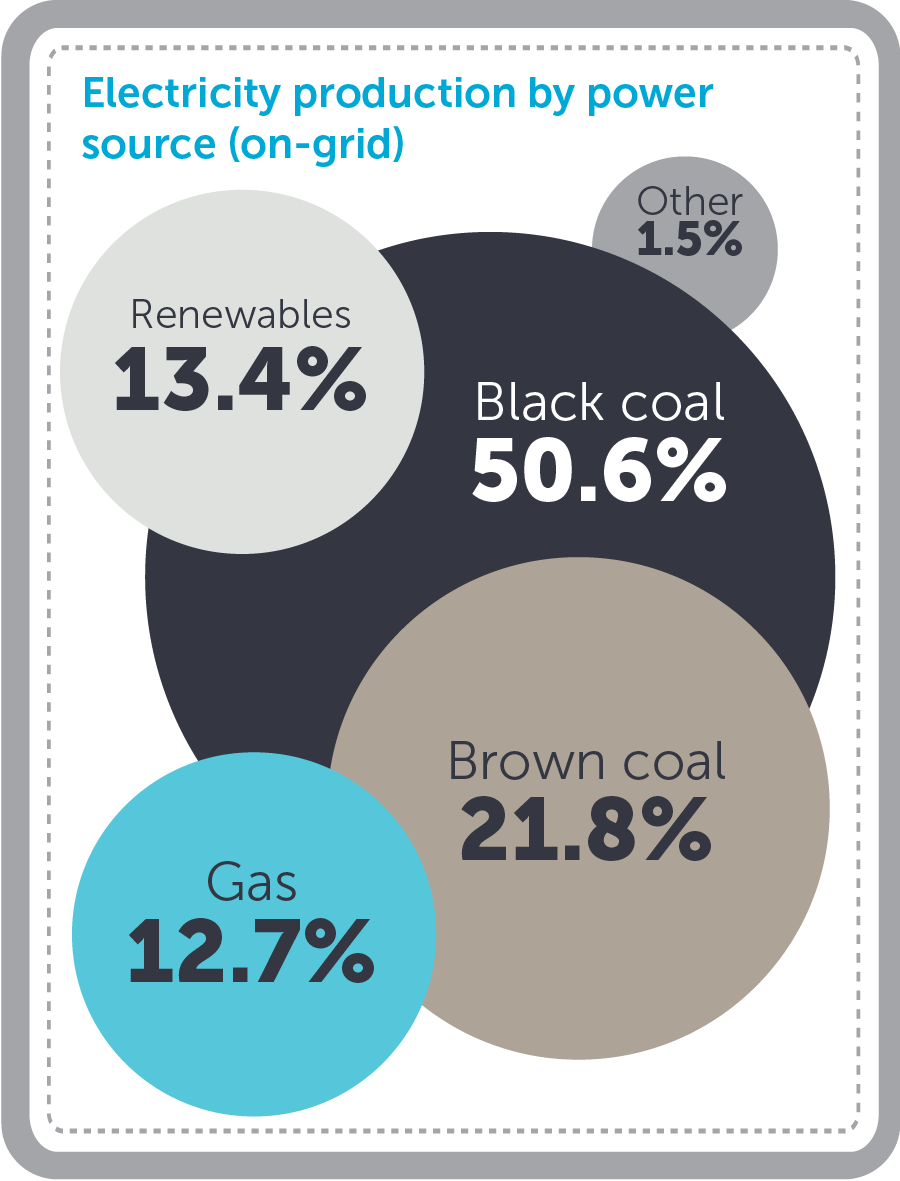
- Emissions from the electricity sector remains the largest contributor to total emissions, accounting for more than half (54.3 percent) of all reported scope one emissions. This is due to an overall increase in black and brown coal-fired electricity generation, and accounts for 0.9 per cent of the overall 2.2 per cent increase.
- The mining and manufacturing sectors also accounted for a further 20.3 percent and 17.4 percent of reported scope 1 emissions respectively. The rise in the manufacturing sector of 1.4 per cent of the overall 2.2 per cent increase, is due to liquefied natural gas (LNG) processing, with large-scale plants either commencing or increasing operations in 2015–16.
2015–16 datasets
Datasets published for the 2015–16 reporting year include:
- Registered corporations report 2015–16
- Reporting transfer certificate holders report 2015–16
- Designated generation facilities report 2015–16
- GreenPower report 2015–16
- Extract of the National Greenhouse and Energy Register 2015–16
It is important to note that information published as part of the 2015–16 National Greenhouse and Energy Reporting dataset cannot be directly compared to publications from previous years for a number of reasons, including the introduction of updated global warming potential values in 2015–16, which affect the carbon dioxide equivalence of greenhouse gases.
See more information about what data is published and why.
2015–16 published data factsheets
A series of factsheets is available, which focus on some of the key data released as part of the 2015–16 data publication.